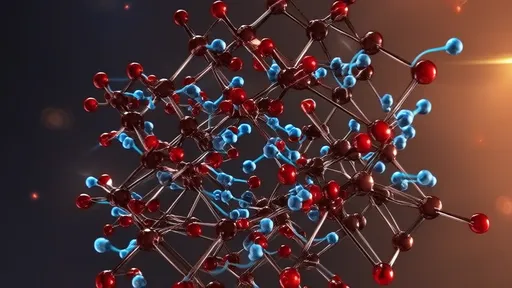
The study of fluid inclusions trapped within ancient hydrothermal ore deposits has emerged as a powerful tool for decoding the geochemical fingerprints of mineralization. These microscopic time capsules, preserved in minerals like quartz, calcite, and sulfides, offer direct insights into the composition, temperature, and pressure conditions of the fluids responsible for metal transport and deposition. Recent advances in analytical techniques have enabled researchers to extract unprecedented detail from these inclusions, revolutionizing our understanding of ore-forming processes.
Unlocking the Secrets of Paleofluids
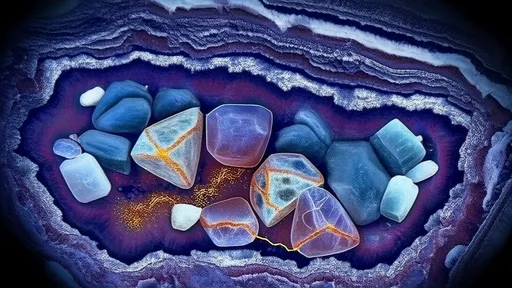
Fluid inclusions represent the most direct evidence available for studying the characteristics of hydrothermal fluids from hundreds of millions of years ago. When minerals crystallize from these fluids, they occasionally trap tiny droplets of the parent solution, preserving them essentially unchanged through geological time. The chemical signatures locked within these inclusions provide critical information about the sources of metals, the nature of fluid-rock interactions, and the physical-chemical parameters that controlled ore deposition.
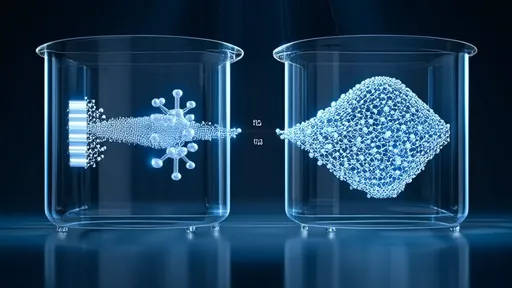
The analytical challenge lies in the extremely small volumes of fluid involved - typically measured in picoliters - and the complex matrices of host minerals. Modern microanalytical techniques including laser ablation-inductively coupled plasma-mass spectrometry (LA-ICP-MS), Raman spectroscopy, and synchrotron X-ray fluorescence have overcome many of these limitations, allowing for multi-element characterization of single inclusions.
Elemental Fingerprints as Exploration Guides
Different ore deposit types exhibit distinctive elemental signatures in their fluid inclusions that reflect their genetic processes. For example, orogenic gold deposits typically show high K/Na ratios with significant concentrations of CO₂ and reduced sulfur species. In contrast, porphyry copper systems display high salinity fluids enriched in Cu, Mo, and sometimes Au, with characteristic Cl/Br ratios that indicate magmatic fluid sources.
The presence of certain trace elements can serve as particularly sensitive indicators of fluid origin and evolution. Elements like Li, B, and Rb often track fluid-rock interaction processes, while the ratios of metals like Pb/Zn or Cu/Au can help distinguish between different mineralization styles within similar geological settings. These geochemical fingerprints are proving invaluable for mineral exploration, allowing geologists to better target areas with high potential for specific deposit types.
Temperature and Pressure Constraints from Fluid Inclusions
Beyond chemical composition, fluid inclusions preserve crucial information about the thermal history of ore-forming systems. Microthermometry techniques measure the temperatures at which phase changes occur in the inclusions - such as ice melting or vapor bubble disappearance - revealing the original trapping conditions. Combined with Raman spectroscopic measurements of gas species, these data constrain the pressure-temperature evolution of hydrothermal systems.
Such information is critical for understanding metal transport mechanisms. Many ore metals form complexes with ligands like chloride or bisulfide whose stability varies dramatically with temperature and pressure. By reconstructing these parameters from fluid inclusions, researchers can model how metals moved through the crust and why they precipitated at particular locations, providing fundamental insights into ore genesis.
Case Studies Revealing Ore-Forming Processes
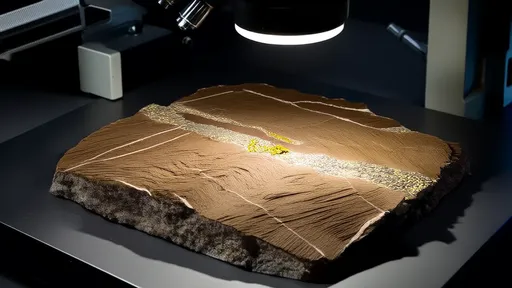
In the Carlin-type gold deposits of Nevada, fluid inclusion studies have demonstrated the importance of hydrocarbon-bearing fluids in gold transport. The inclusions contain detectable amounts of liquid petroleum along with aqueous solutions, suggesting an unconventional gold transport mechanism involving organic complexes. This finding has forced a reevaluation of exploration models for sediment-hosted gold systems worldwide.
Similarly, analyses of fluid inclusions from the giant Olympic Dam deposit in Australia revealed a previously unrecognized role of highly saline, iron-rich brines in copper mineralization. The inclusions showed extreme enrichments in rare earth elements and uranium, providing clues to the unusual metal association characteristic of this deposit type.
These case studies illustrate how fluid inclusion geochemistry can overturn long-held assumptions about ore formation. The ability to measure actual metal concentrations in paleofluids represents a quantum leap forward from earlier inferences based solely on mineral assemblages or theoretical calculations.
Future Directions in Fluid Inclusion Research
Emerging technologies promise to further enhance our ability to extract information from fluid inclusions. NanoSIMS (nanoscale secondary ion mass spectrometry) now allows isotopic measurements at the scale of individual inclusions, opening new avenues for tracing fluid sources. Cryogenic techniques that prevent inclusion decrepitation during analysis are improving the accuracy of volatile species measurements.
Perhaps most exciting is the development of non-destructive, in situ analysis methods that preserve the spatial context of inclusions within their host minerals. This capability is crucial for understanding how fluid compositions evolved during mineral growth - did metals precipitate gradually or in discrete pulses? Did fluid sources change over time? Answers to such questions will provide unprecedented resolution of ore-forming processes.
The integration of fluid inclusion data with other geochemical and geological information is yielding comprehensive genetic models for ore deposits. As analytical capabilities continue to advance, fluid inclusions will undoubtedly reveal more secrets about Earth's mineral wealth, guiding future exploration efforts and improving our fundamental understanding of hydrothermal systems.
By /Jun 19, 2025

By /Jun 19, 2025

By /Jun 19, 2025

By /Jun 19, 2025

By /Jun 19, 2025

By /Jun 19, 2025
By /Jun 19, 2025

By /Jun 19, 2025

By /Jun 19, 2025

By /Jun 19, 2025
By /Jun 19, 2025

By /Jun 19, 2025
By /Jun 19, 2025

By /Jun 19, 2025

By /Jun 19, 2025
By /Jun 19, 2025

By /Jun 19, 2025